How do you visualize your recruitment process?
Discover how process visualization transforms your recruitment with practical methods and tools for more efficient hiring.

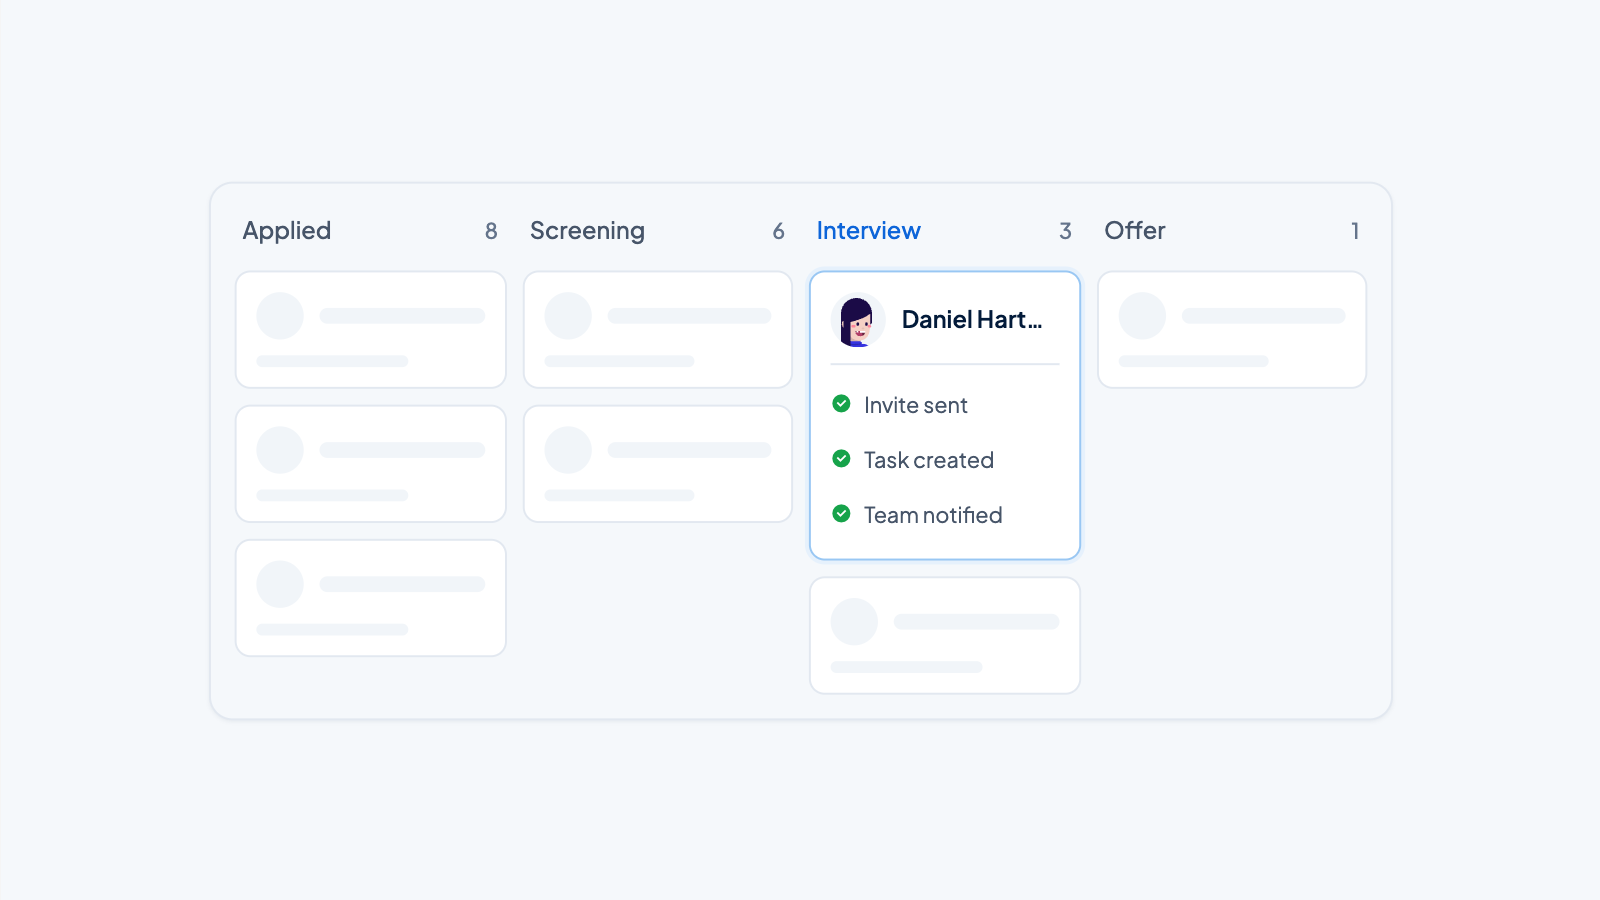
Visualizing your recruitment process means turning all the steps, people involved, and decisions in your recruitment workflow into a visual representation, such as a flowchart or process map. This approach helps HR teams identify bottlenecks, improve communication, and create more efficient workflows. Visualization transforms complex processes into clear overviews that everyone can follow.
What does it mean to visualize your recruitment process?
Process visualization in recruitment means creating a visual representation of every step you go through, from job opening to hire. Instead of text-based descriptions, you use diagrams, flowcharts, and process maps to make the workflow clear for everyone involved.
This approach is fundamentally different from traditional documentation. Where text documents often remain unclear about the sequence of steps and responsibilities, a visual process map immediately shows who does what and when. You see at a glance what candidates go through and which decisions are made.
The benefits of a visual representation are significant. Team members understand their role in the process faster, new colleagues are onboarded more efficiently, and everyone speaks the same language when it comes to the recruitment workflow. Moreover, gaps and inefficiencies become visible much more quickly than in text-based process descriptions.
Why is visualizing your recruitment process so important?
Visualizing your recruitment process leads to better communication among everyone involved and helps identify bottlenecks that would otherwise go unnoticed. It improves the candidate experience because processes run more consistently and reduces wait times through clearer workflows.
The concrete benefits are measurable in your daily recruitment activities:
- Team members know exactly when it’s their turn to act
- Candidates receive consistent communication, regardless of who is guiding them
- Managers can quickly see where processes are getting stuck
- New team members learn the process much faster
- Improvements can be implemented in a more targeted way
For decision-making, process visualization is indispensable. You immediately see where most time is lost, which steps are redundant, and where automation will have the greatest impact. This leads to data-driven optimizations rather than assumptions about what could be better.
Which methods can you use to map your recruitment process?
The most effective visualization methods are flowcharts, swimlane diagrams, process maps, and Kanban boards. Each method has specific advantages, depending on your organization and the complexity of the recruitment process.
Flowcharts work excellently for linear processes with clear decision points. They show the logical flow from step to step and make decision points explicitly visible. This method is ideal for smaller teams with relatively simple processes.
Swimlane diagrams are perfect when multiple departments are involved. Each “lane” shows the responsibilities of a specific role or department, making it clear who needs to take action and when. This prevents confusion about responsibilities.
Process maps offer the most detailed overview and are suitable for complex organizations. They show not only the steps but also time spent, resources, and quality criteria per phase.
Kanban boards are dynamic and show the current status of all ongoing recruitments. They are less suitable for process design but excellent for daily workflow management.
How do you start creating a visual recruitment process map?
Start by interviewing everyone involved in your recruitment process to get a complete picture of all steps, decisions, and handover moments. Gather information from recruiters, hiring managers, HR staff, and even recent candidates about their experiences.
Follow these practical steps for your first process visualization:
- Organize interviews with all stakeholders
- Document every step, from job opening to contract
- Identify all decision points and criteria
- Determine who is responsible for each step
- Where possible, measure the time spent per phase
- Collect feedback about frustrations and bottlenecks
Practical tips for information gathering: use a standard questionnaire for consistency, organize group sessions for different perspectives, and observe the process in practice alongside interviews. Also document exceptions and escalation procedures.
Start with a rough sketch before moving to detailed diagrams. This helps you clarify the main lines without getting lost in details.
Which tools and software are most suitable for recruitment process visualization?
The best tools combine ease of use with professional features, such as Lucidchart, Miro, Visio, and specialized recruitment software. Your choice depends on team size, budget, and desired functionalities.
Lucidchart is excellent for professional process diagrams with extensive templates and collaboration features. It integrates well with other business tools and offers robust export options, but is relatively expensive for smaller teams.
Miro excels in creative brainstorming sessions and collaborative process design. The interface is intuitive and the platform supports various visualization types. It is less suitable for highly detailed process diagrams.
Microsoft Visio remains the standard for technical process diagrams with high precision and extensive functionalities. Ideal for large organizations, but it has a steep learning curve and higher costs.
Specialized recruitment software, such as modern applicant tracking systems, often includes built-in process visualization. These tools combine process design with actual workflow automation, which is particularly valuable for implementation.
How do you optimize your recruitment process after visualizing it?
After visualization, you identify inefficiencies and automation opportunities by analyzing bottlenecks, redundant steps, and manual tasks. Use the visual representation as a basis for systematic improvements and continuous optimization of your recruitment workflow.
Practical optimization steps start with identifying the biggest time-wasters and frustrations. Look for steps that are often skipped, moments when candidates drop off, and tasks that require a lot of manual work. These are your first improvement opportunities.
Automation opportunities become clearly visible in your process map. Think of automatic email responses, scheduling interviews, status updates to candidates, and reports to management. Modern recruitment software can take over many of these tasks.
For continuous optimization, treat the visualization as a living document. Update it regularly based on new insights, measure the impact of changes, and involve your team in improvement suggestions. A well-visualized process makes it easy to implement changes and monitor the effects.
How Applyfin helps with process visualization in recruitment
Applyfin offers a complete solution for visualizing and optimizing your recruitment process by combining advanced workflow automation with intuitive process visualization. Our platform transforms your visualized processes directly into working workflows that save time and improve the candidate experience.
With Applyfin you get access to:
- Visual process designer that directly creates workflows
- Automated communication at every point in your process
- Real-time insights into bottlenecks and process efficiency
- Seamless integration with your existing HR systems
- Customizable dashboards for all stakeholders
Discover how Applyfin takes your recruitment process to the next level. Book a free demo and experience how process visualization and automation together deliver measurably better recruitment results.