
Performance
Lost track of performance.
How many applied per vacancy, how each department is doing, what's slowing time to hire. It all stays hidden in different tools.
Hiring without data quickly stops scaling. Without live numbers, recruiters lose grip on what's actually driving the funnel. Applyfin tackles multiple challenges at once.
How many applied per vacancy, how each department is doing, what's slowing time to hire. It all stays hidden in different tools.
Promotion budget per role and cost per hire live in different tools. The channels that actually deliver are hard to spot.
Spreadsheets, charts and recap notes pulled together every Friday. No automated summary tells you what changed and why.
Pipeline data and career-page data usually live in two separate places. This means recruiters spend time piecing the picture together by hand. In Applyfin both views sit side by side, in real time.
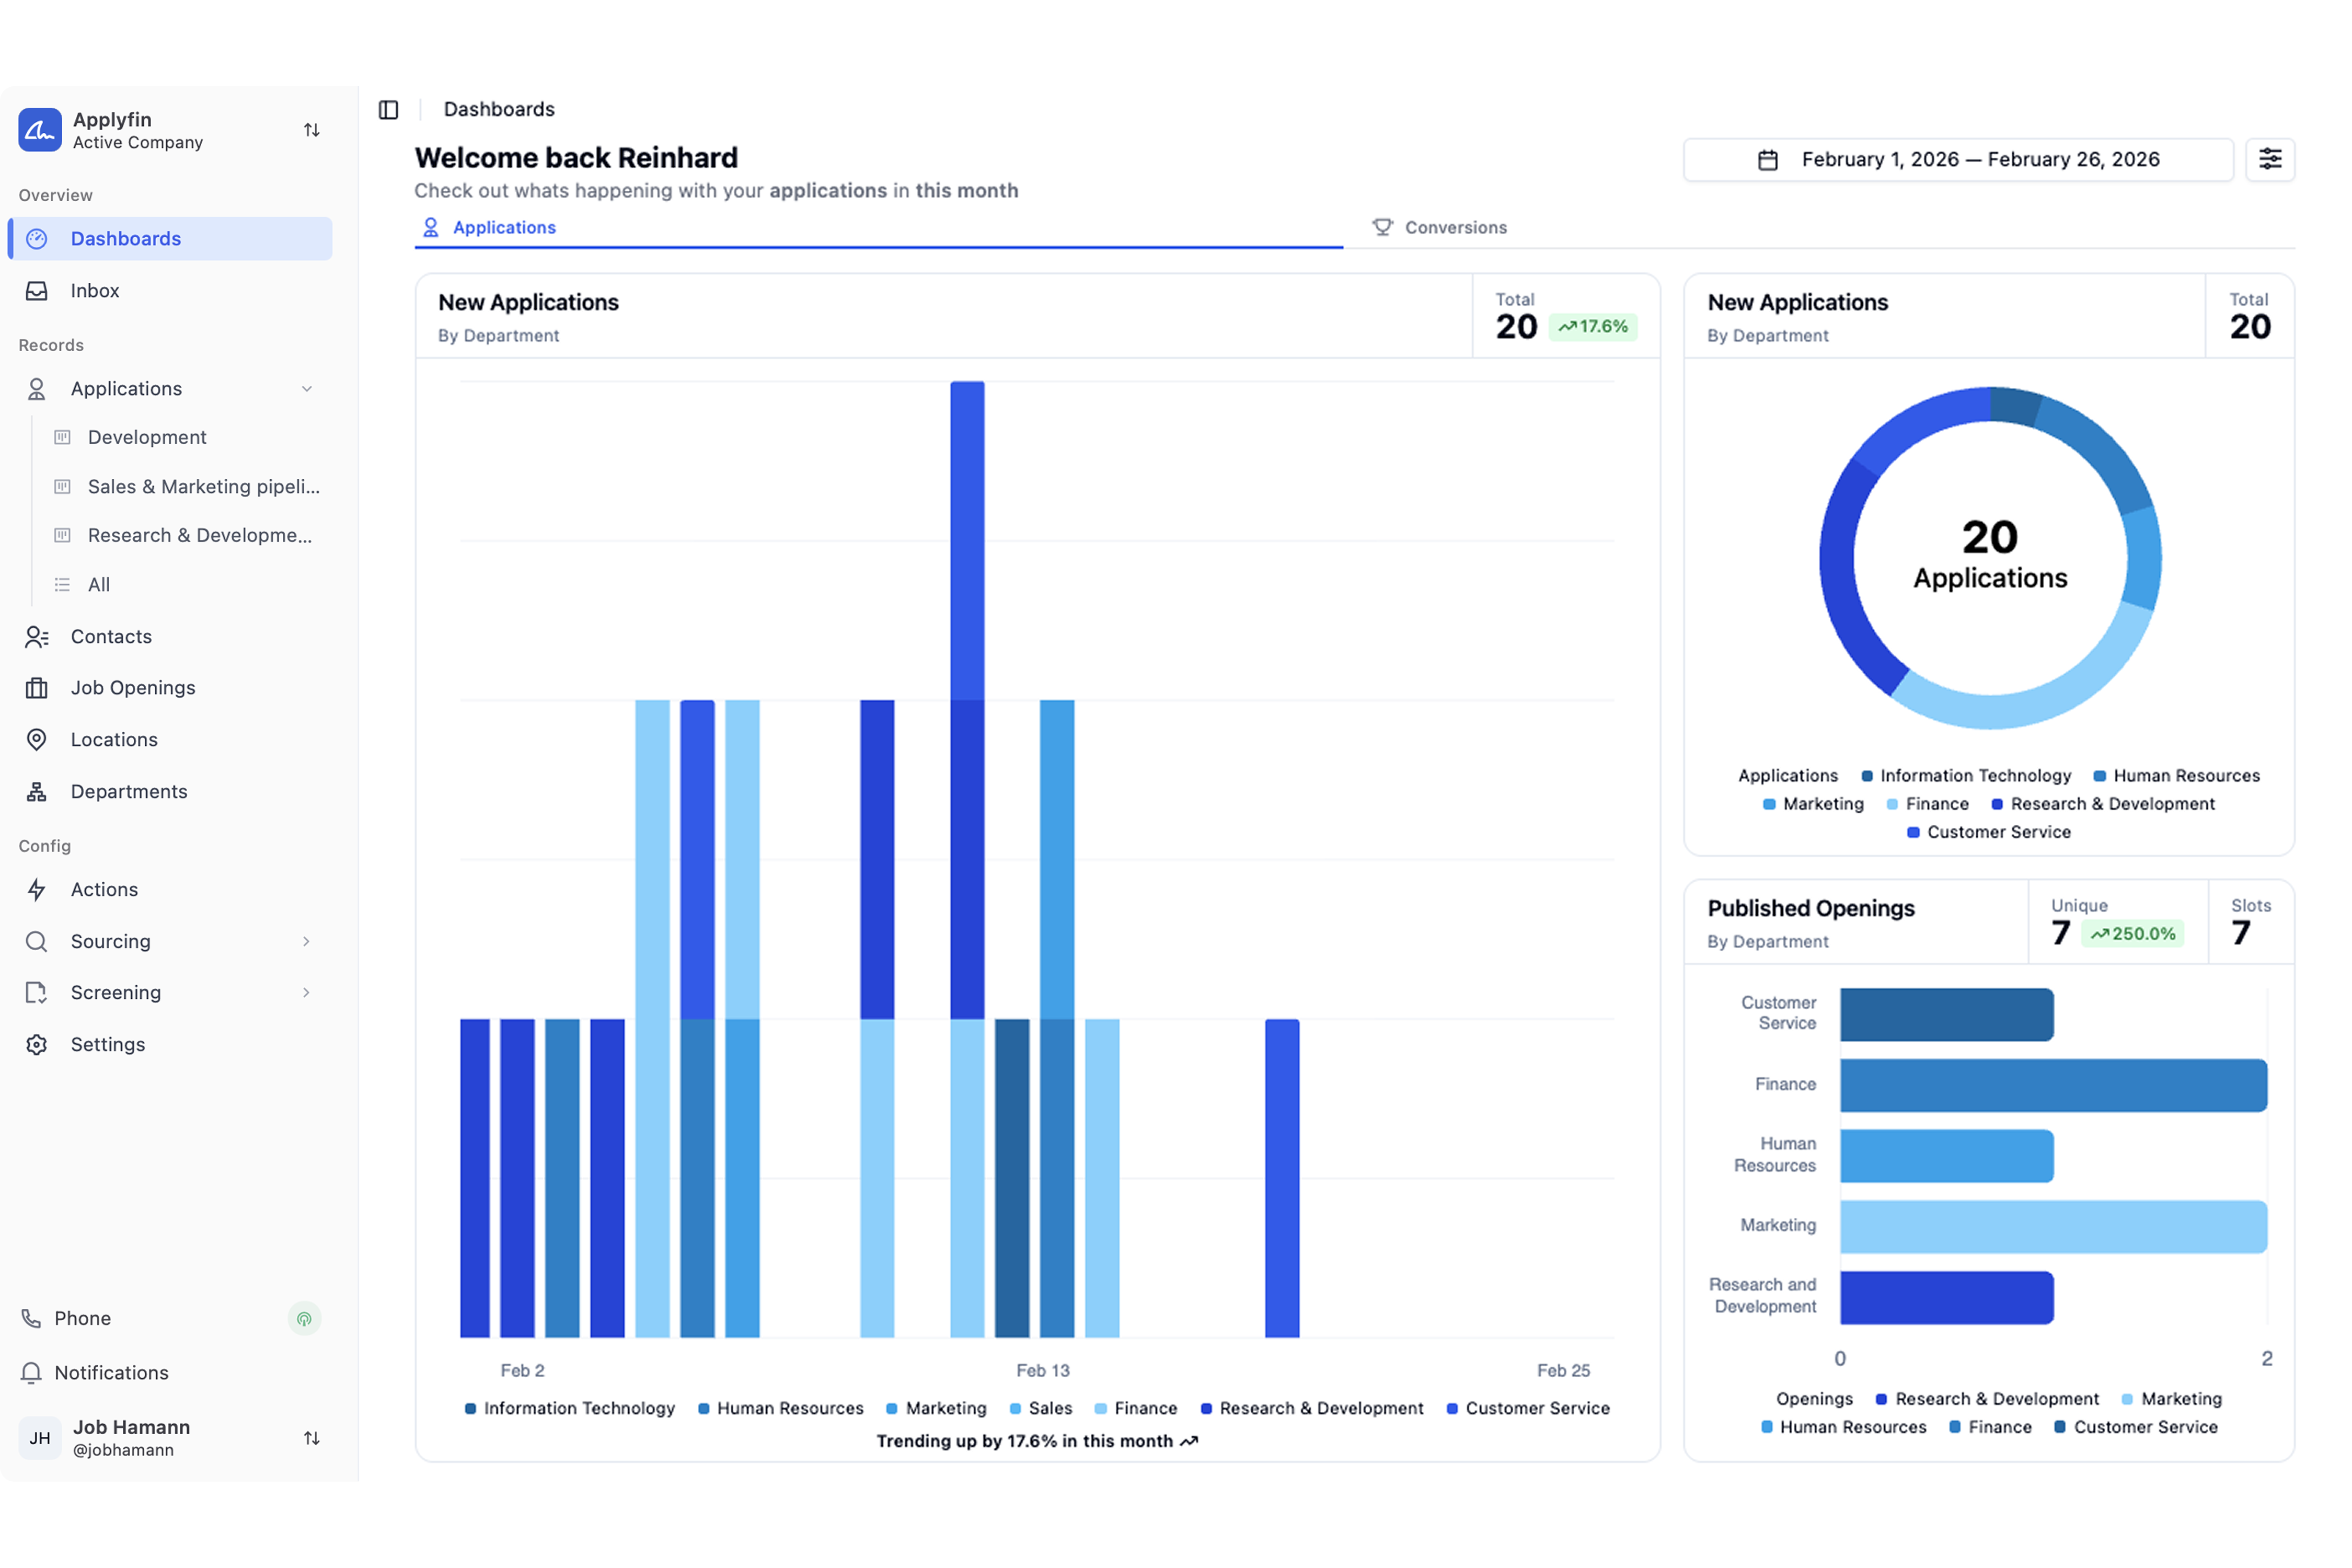
Applicationvolume,hiresandtrendsperroleinoneview.Filterbyrecruiter,sourceorlocation.Numbersupdatelive,noexportsneeded.
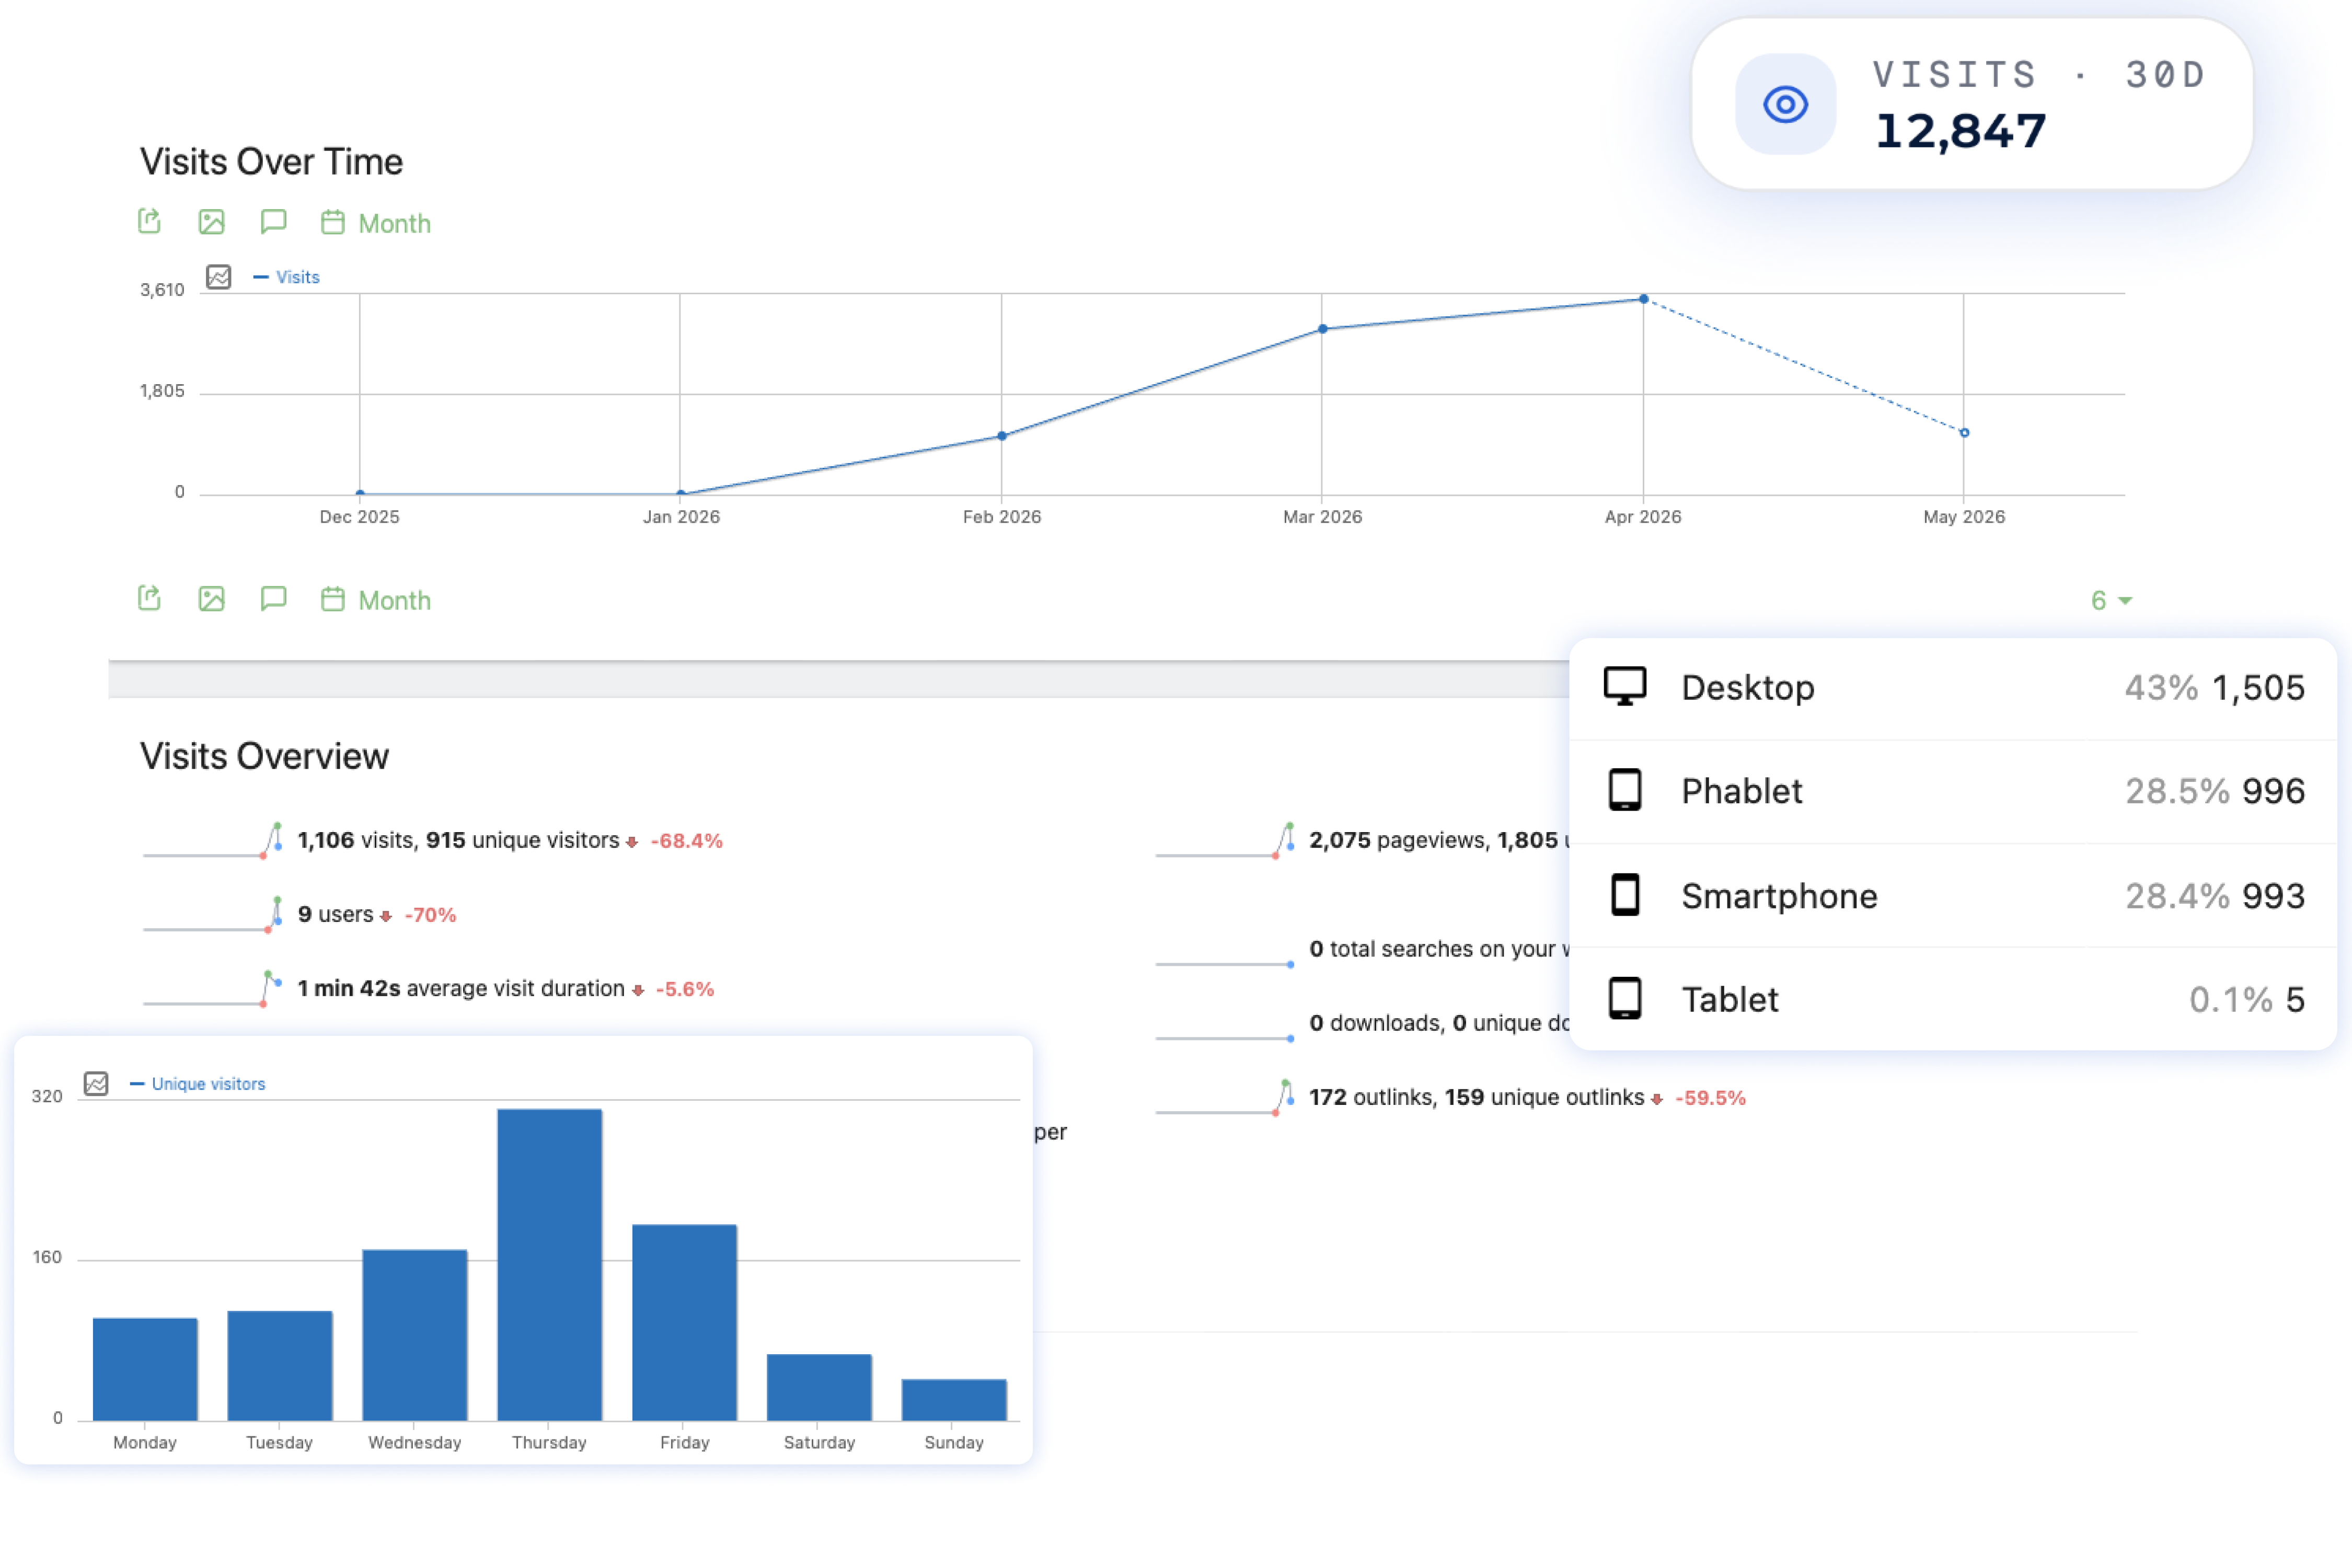
Trackeverystepavisitortakes,downtotheapplybutton.Seewheretheydropoffandwhatholdsattention.Spotpagesthatneedacopyorlayoutfix.
Channel and funnel data typically sit in different dashboards. Without both side by side, it's hard to tell where to spend or what to fix. See where applicants come from and where they drop off, on one screen.

Theperformanceofeverychannelinonedashboard.Doubledownonwhatworksandcutwhatdoesn't.Comparecostperapplicantandqualitysidebyside.
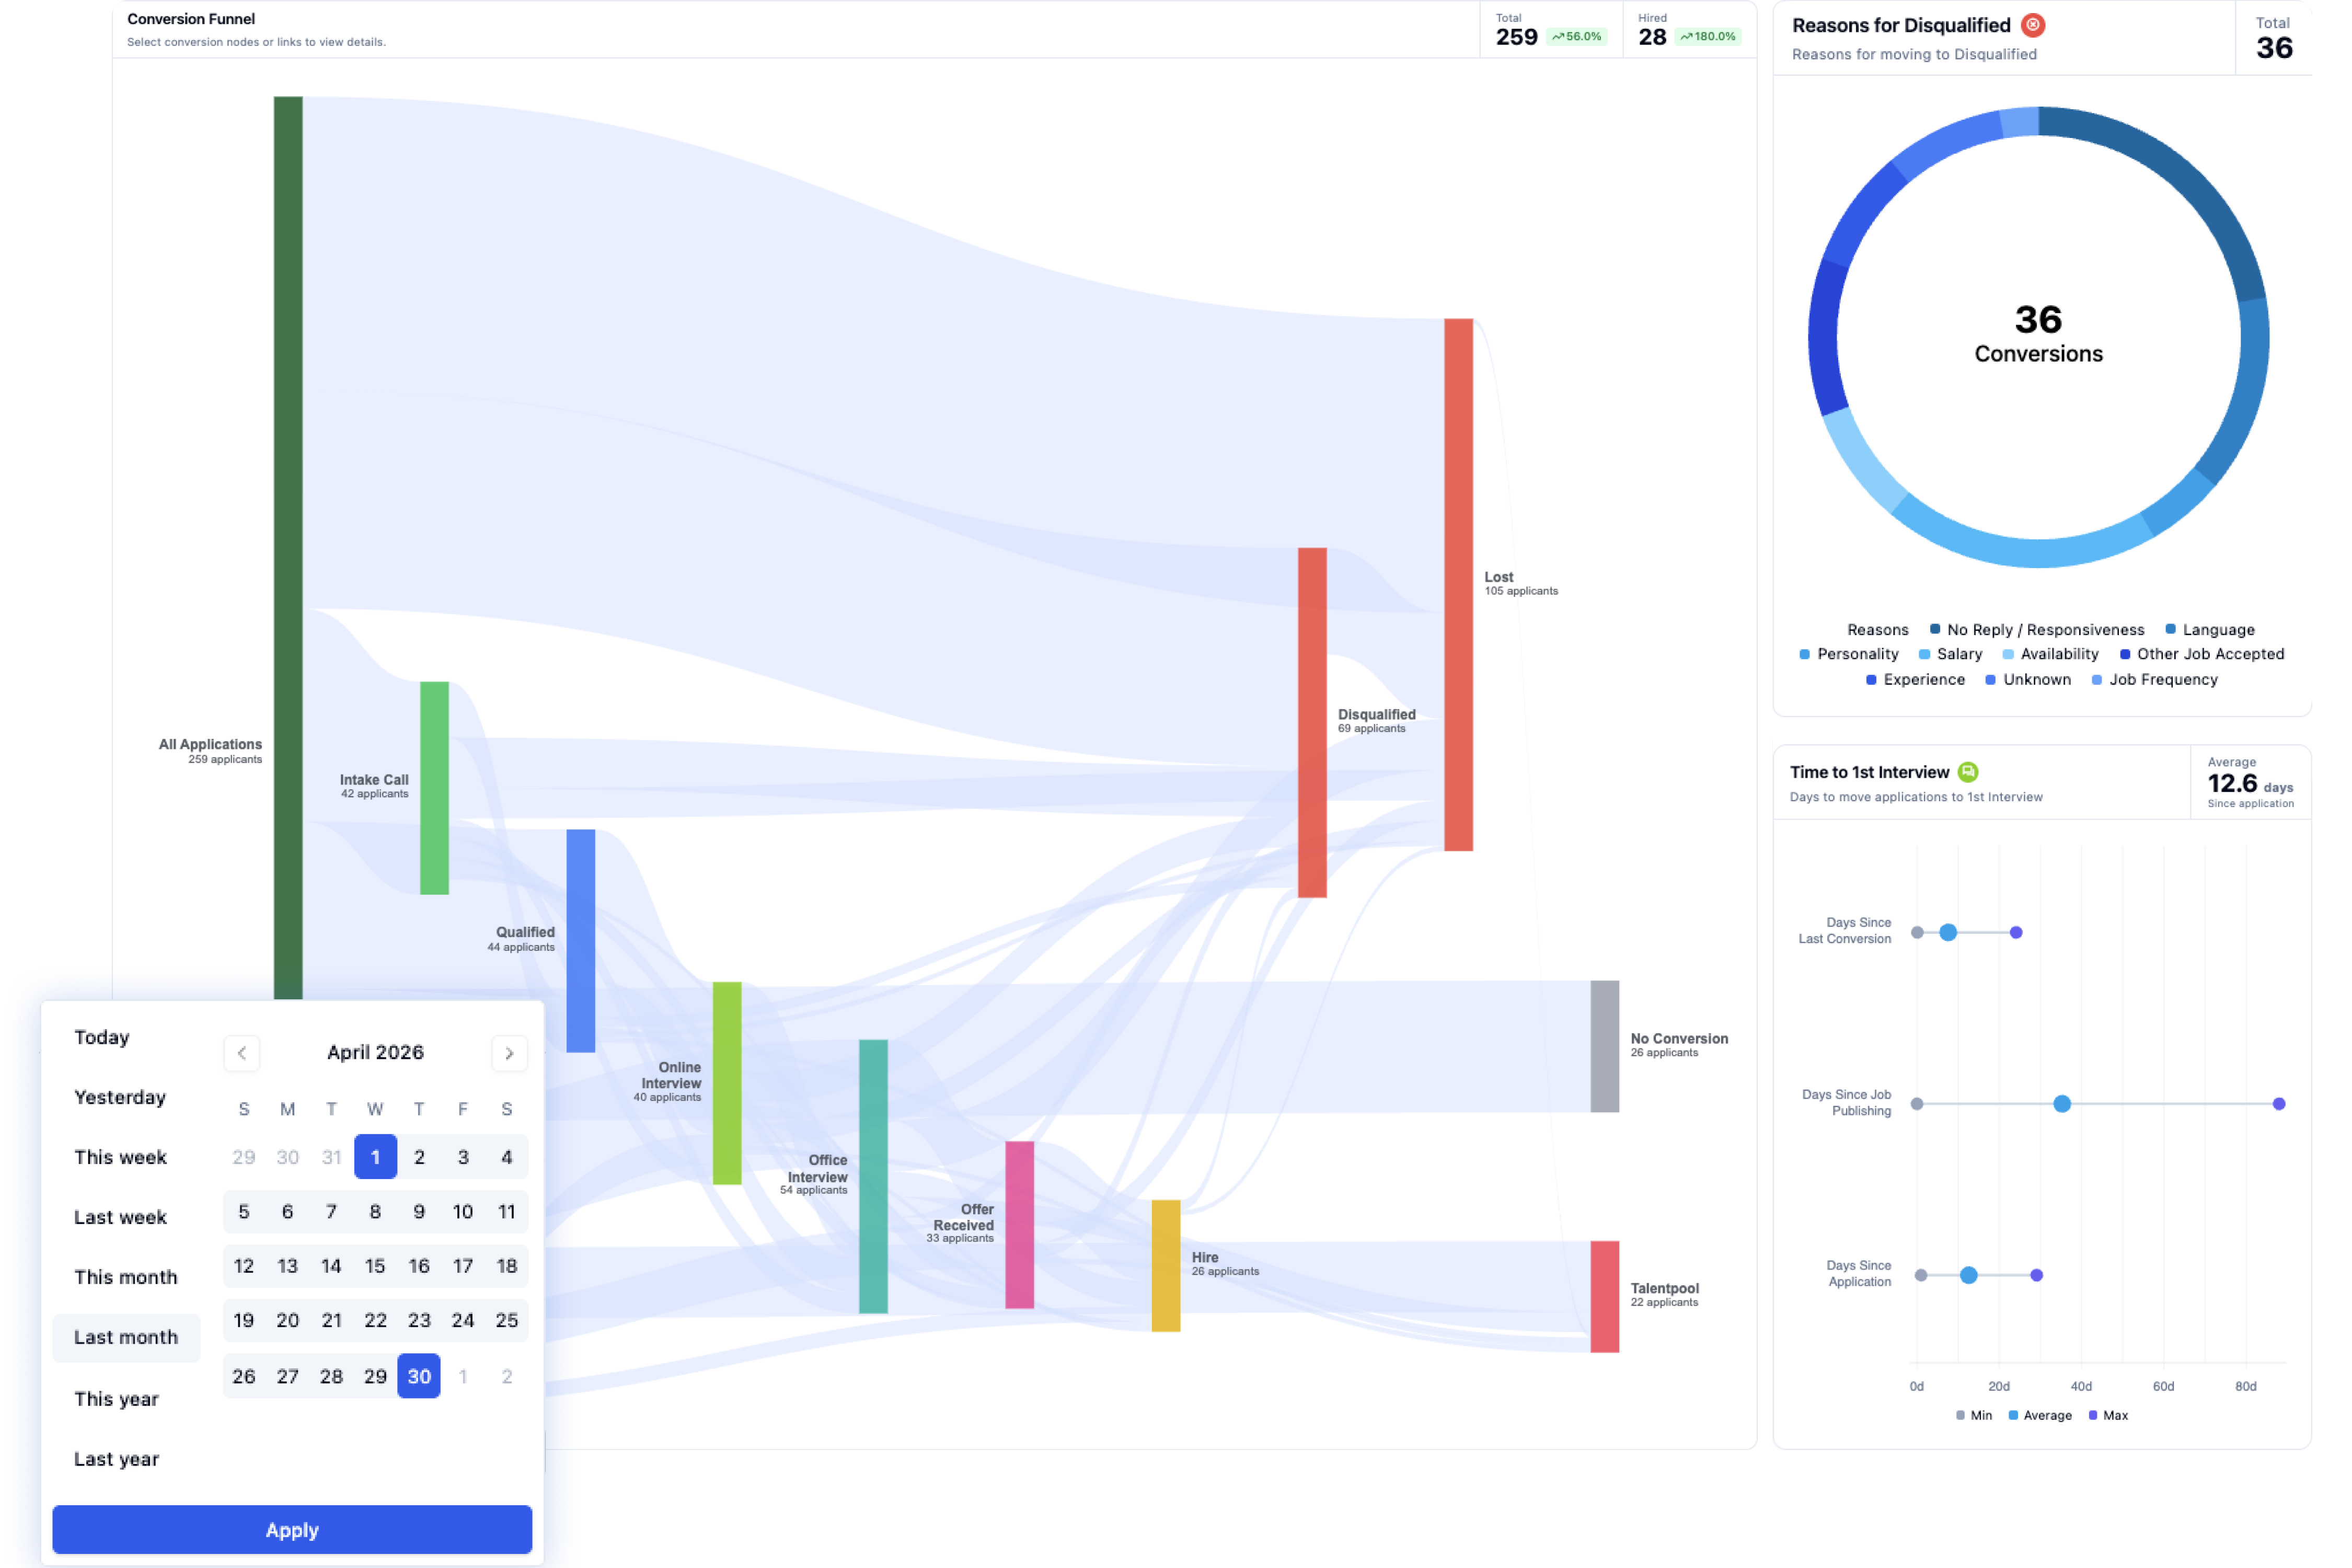
Drop-offchartsperstageofthepipeline.Seethereasonsforconversionandthetimeittakestomovebetweenstages.Spottheleakinsteadofguessing.
Stakeholders tend to ask for updates outside the platform. As a result, recruiters spend time pulling and formatting numbers each week. Reports and exports are generated for you.
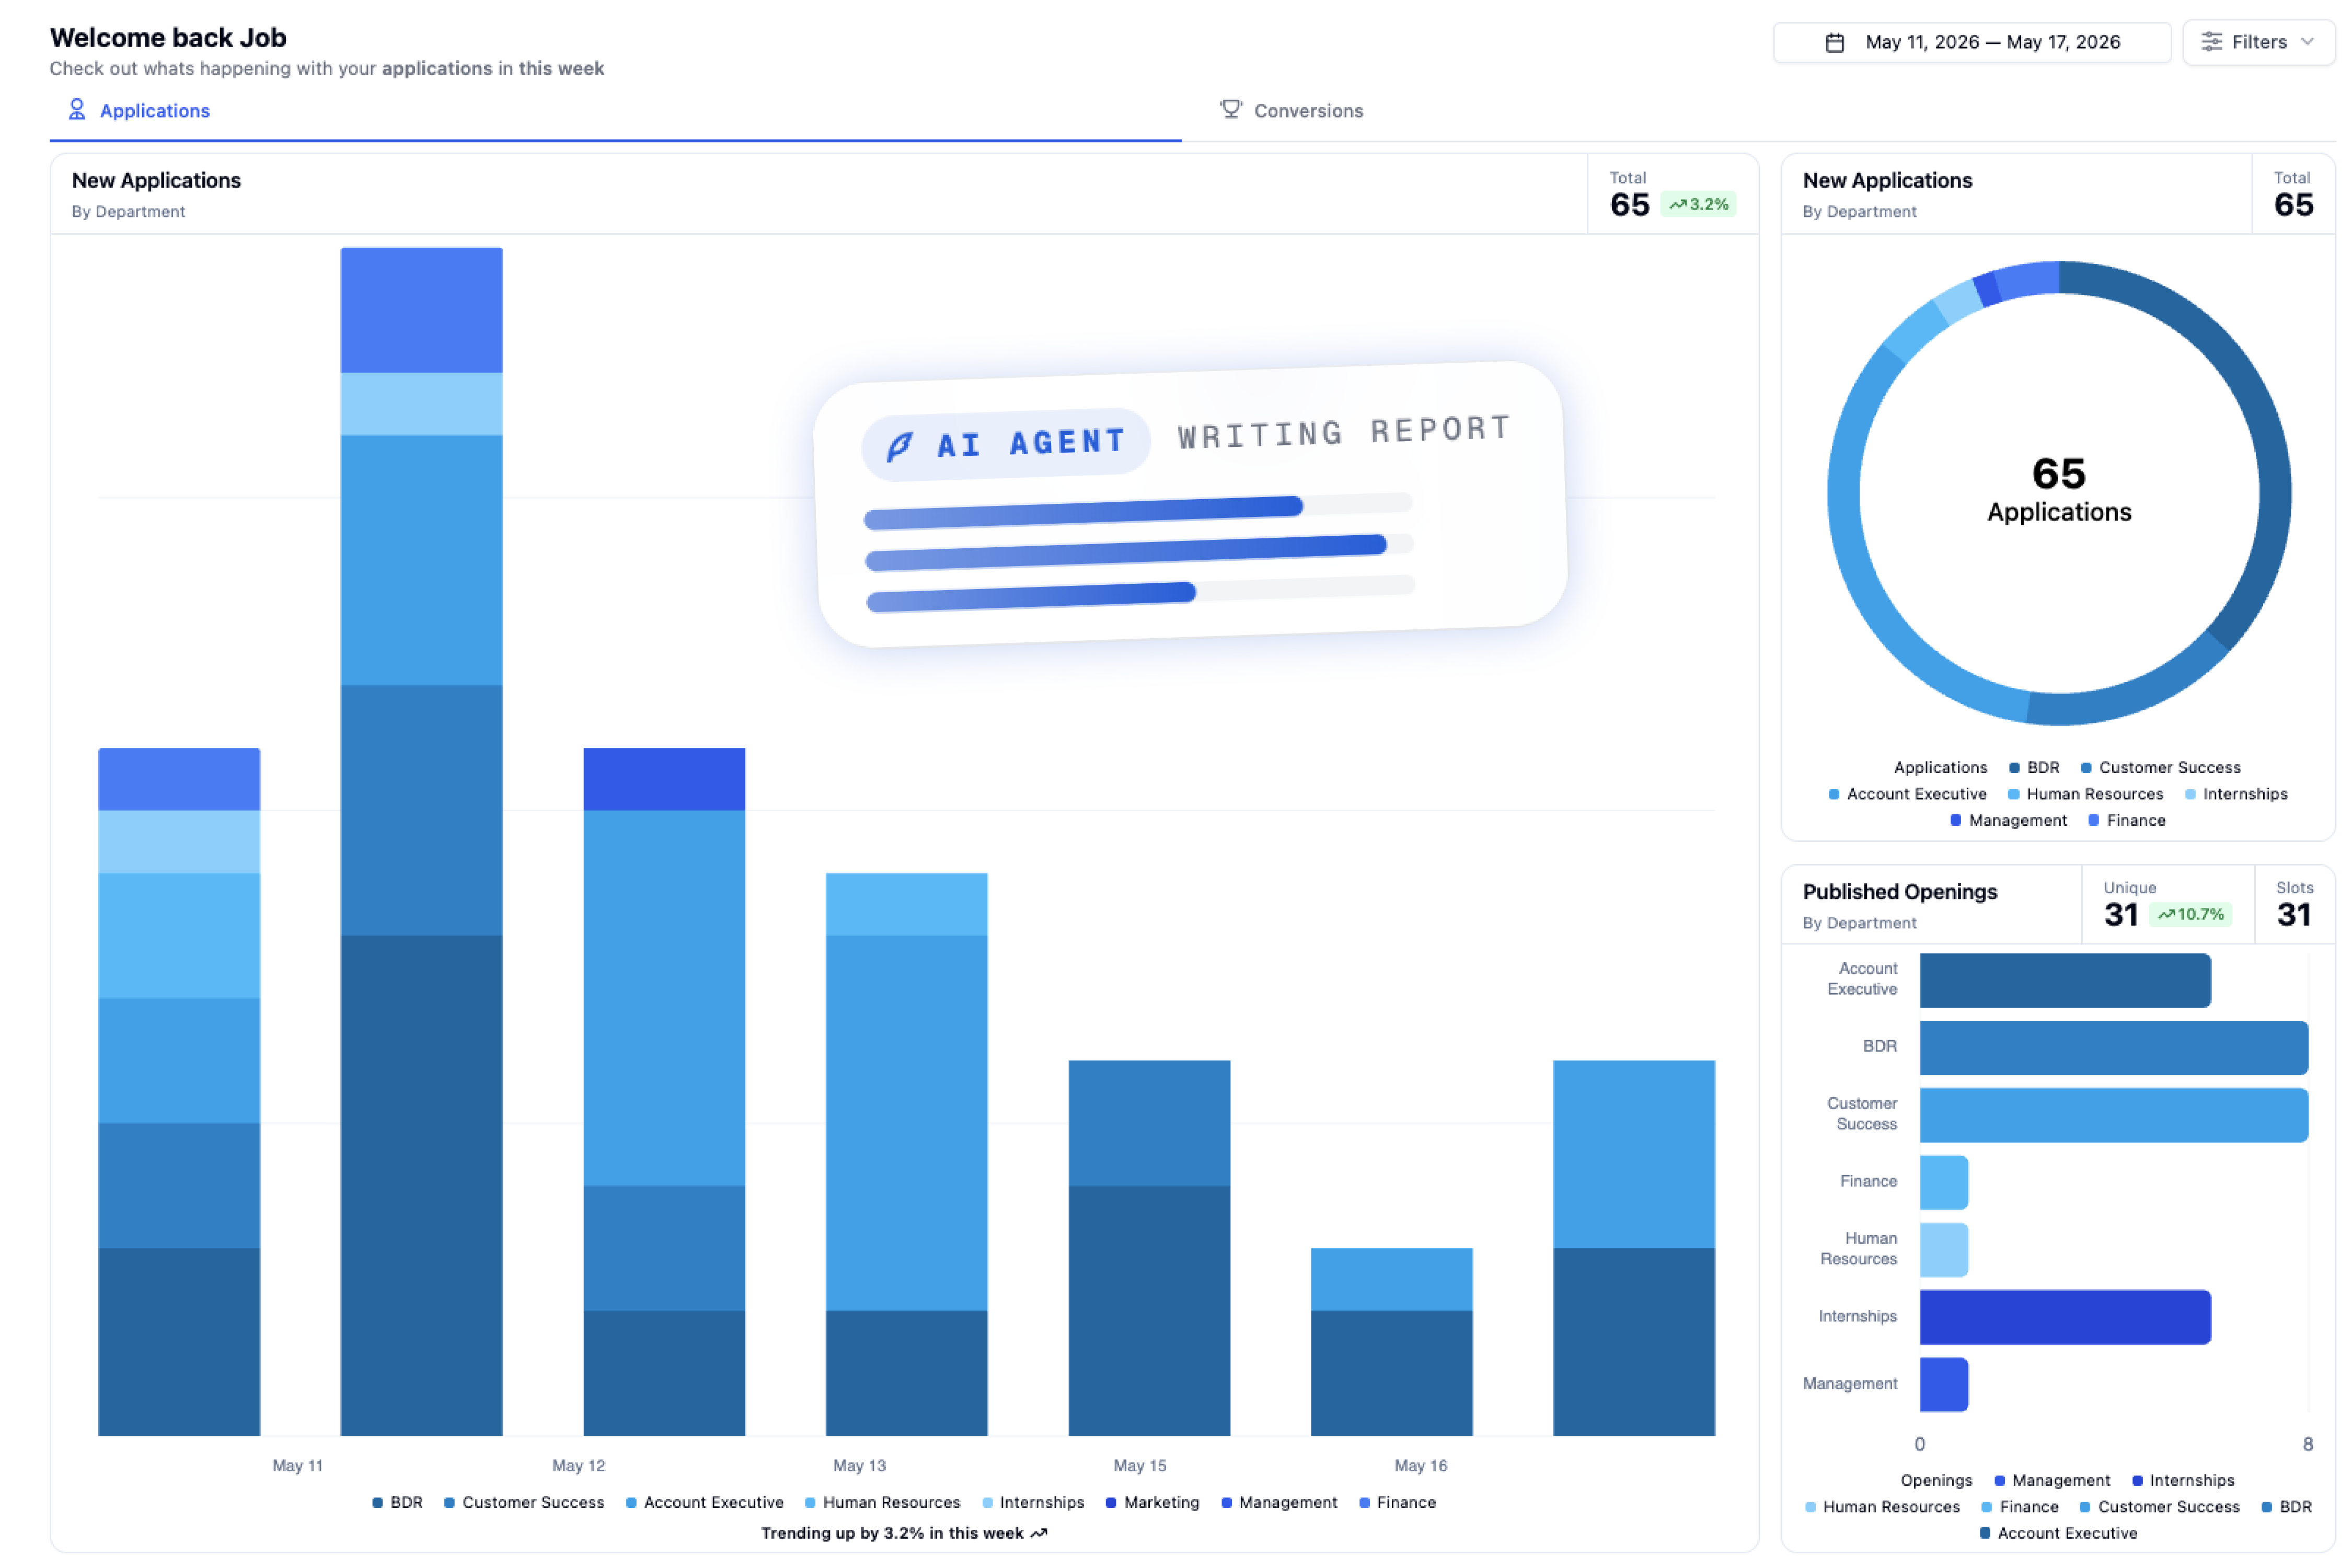
Getawrittenreportonanydashboardwithoneclick.Trainedonyourdata,inyourtoneofvoice.Sharewithstakeholderswithoutrebuildingthedeck.
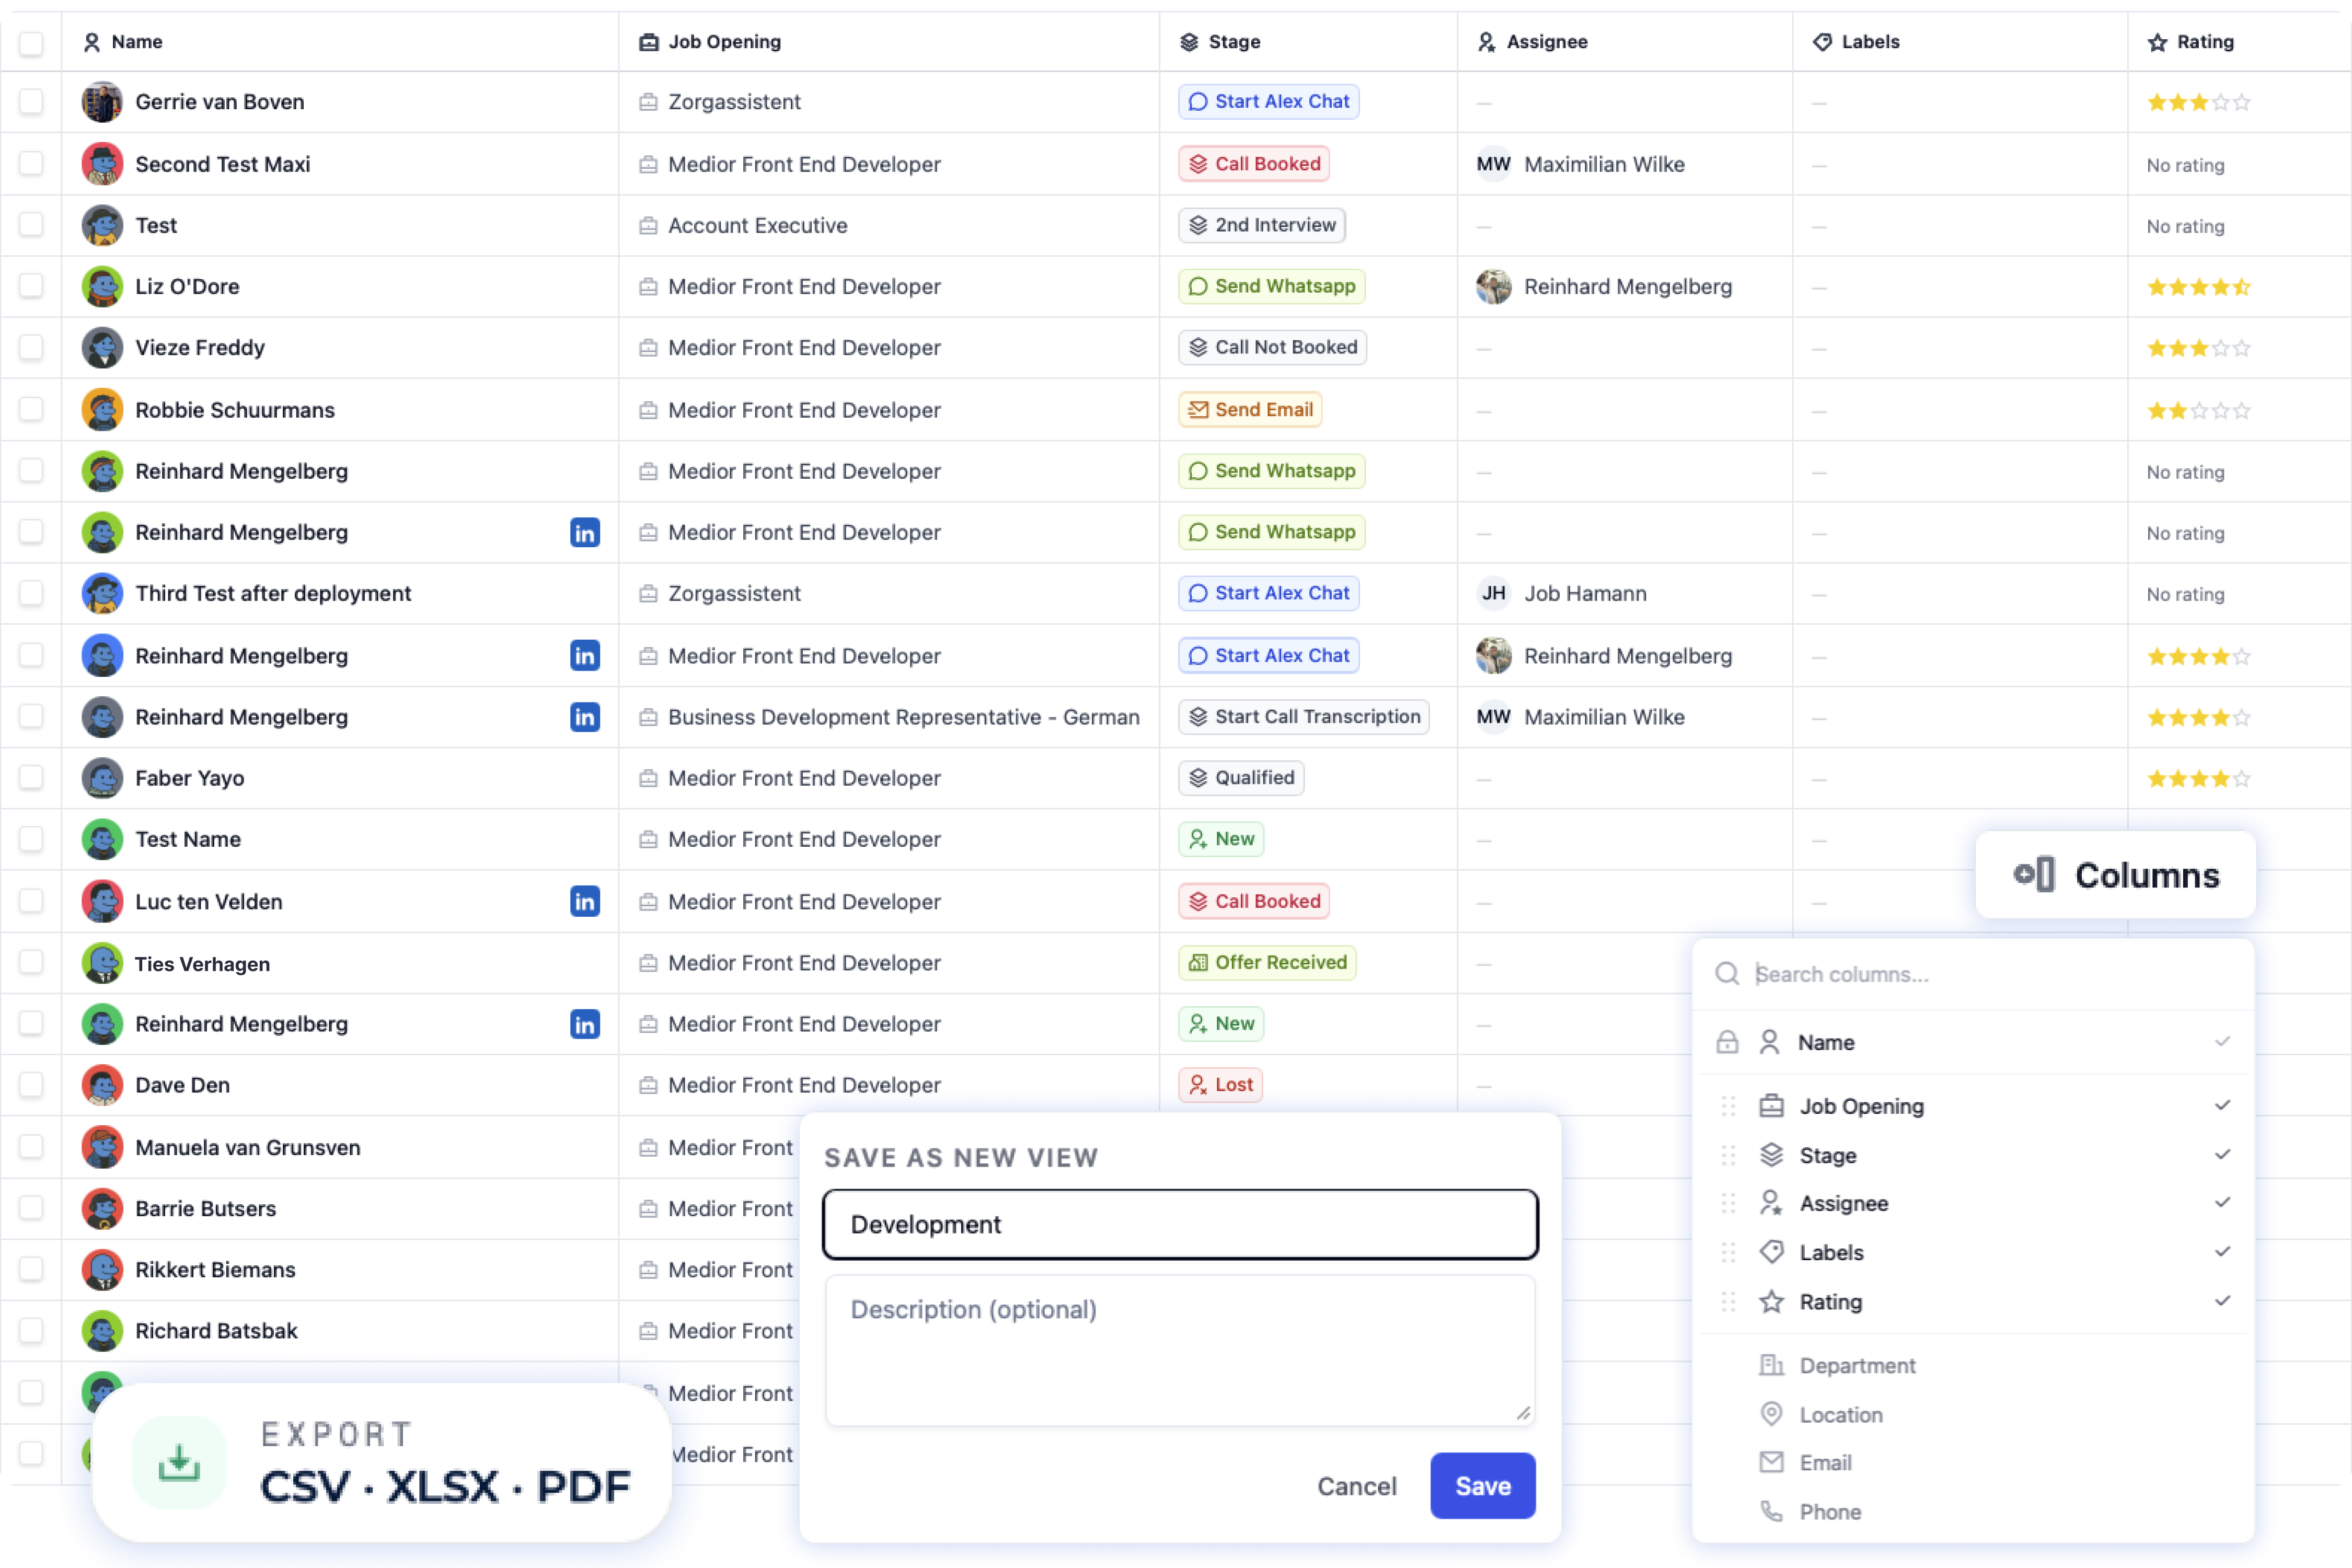
Exportcandidatelistsintheformatthereceiverneeds.Pickthecolumnsandfiltersonce.Re-runtheexportlaterwithoutsettingitupagain.