How do you visualize recruitment pipelines?
Visualizing a recruitment pipeline gives you immediate insight into where candidates are in your process and where delays occur. Discover which stages are essential, from job posting to onboarding, and learn which metrics to monitor, such as time-to-hire and conversion rates. We discuss practical tools from spreadsheets to advanced ATS systems, and how to interpret data to identify bottlenecks and continuously improve your process.

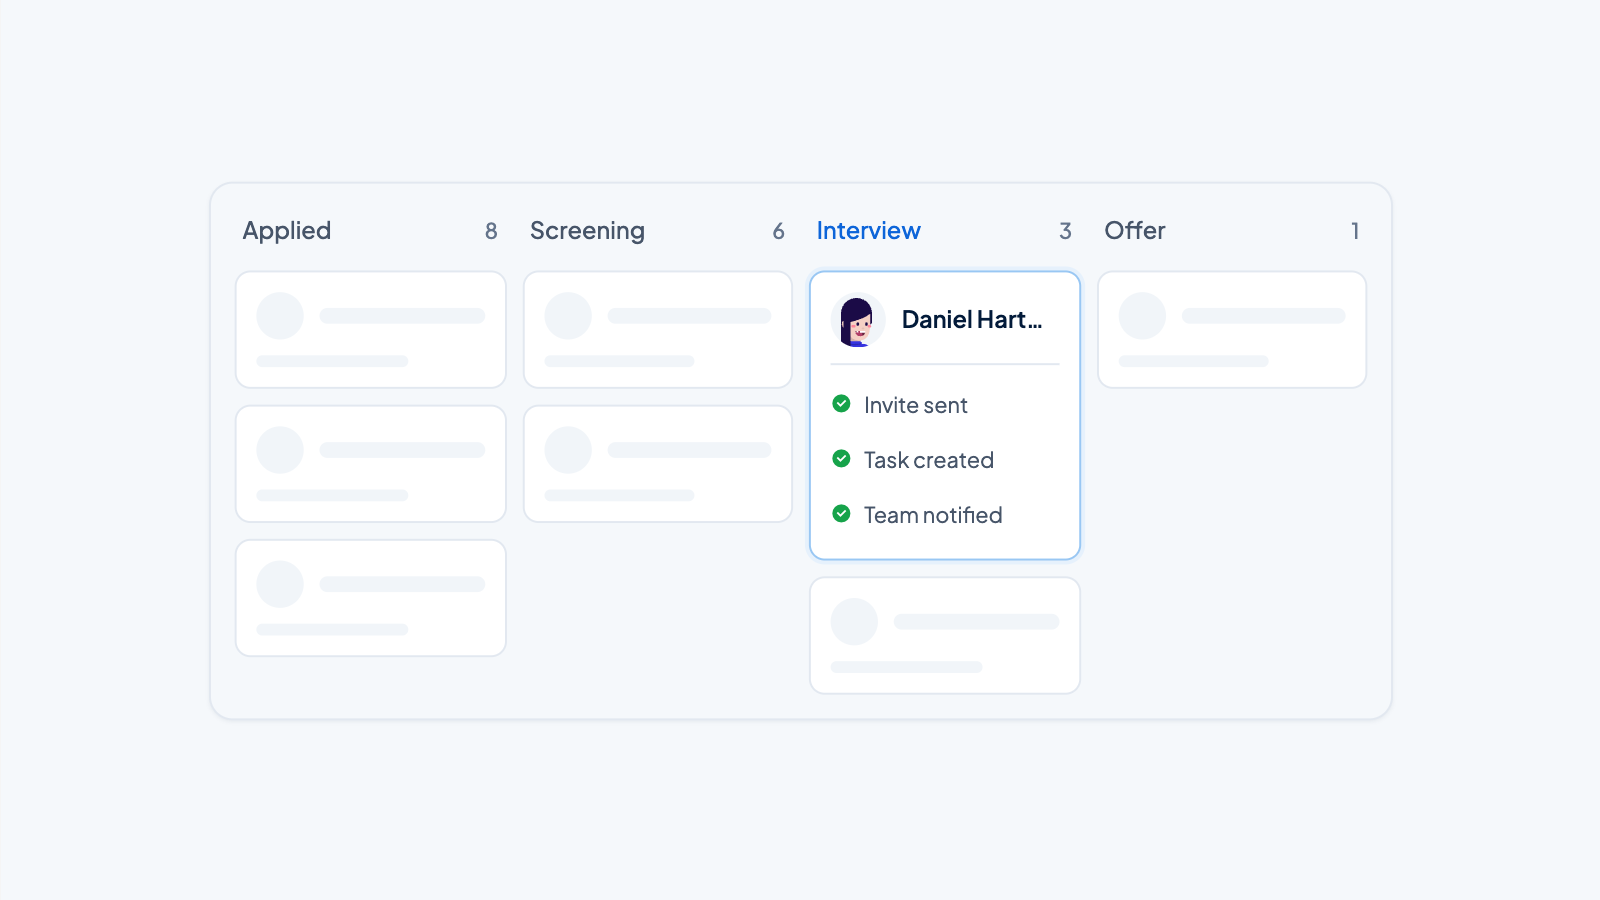
Visualizing a recruitment pipeline means graphically representing all the steps and candidates in your hiring process. This visualization gives you immediate insight into where candidates are, how many people are in each stage, and where delays occur. This helps HR teams make faster decisions, identify bottlenecks, and create transparency for everyone involved in the hiring process.
What is a recruitment pipeline and why should you visualize it?
A recruitment pipeline is the structured journey candidates go through from the moment they apply until they are hired. Visualization makes this process visible by clearly displaying each stage and the number of candidates per stage, so you immediately see where action is needed.
For recruiters and hiring managers, this visualization has become indispensable. You see at a glance where candidates get stuck, which stages take too long, and where your team needs to focus. This prevents losing good candidates because they wait too long for a response or because the process is unclear.
Modern HR teams also use visualization to make better decisions based on data. For example, you can see whether certain sourcing channels deliver better candidates or if your screening process is too strict. This transparency also helps align expectations with hiring managers about how many candidates are needed to successfully fill a vacancy.
The insights from a visualized pipeline make the difference between reactive work and proactive steering. Instead of waiting for problems to arise, you see trends and patterns that help you continuously improve the hiring process.
Which stages belong in a visualized recruitment pipeline?
An effective recruitment pipeline visualization includes all key steps of the hiring process. Each stage should be clearly measurable and contain relevant data that helps you optimize your process.
The essential stages you should visualize are:
- Job posting – Track where and when jobs are posted, including which channels you use and how much reach each posting generates
- Application receipt – Record the total number of incoming applications per source, so you see which channels deliver the most candidates
- Screening and selection – Monitor how many candidates pass the initial screening and which criteria are used
- Interviews – Track how many candidates are invited for interviews, how many interviews actually take place, and what the outcomes are
- Offer – Track the number of offers made, how many are accepted, and the reasons for rejections
- Onboarding – Record when candidates actually start and whether they successfully complete onboarding
For each stage, it's important to track specific data. Think of time spent per stage, number of candidates advancing to the next step, and reasons why candidates drop out. This information helps you understand where your process is effective and where improvements are possible.
How do you choose the right metrics for your recruitment pipeline dashboard?
Choosing the right metrics starts with determining what goals you want to achieve with your hiring process. Focus on KPIs that directly impact your main challenges, such as speeding up hires or improving candidate quality.
The most important metrics for most HR teams are time-to-hire (how long the entire process takes), conversion rates per stage (what percentage moves to the next step), and number of candidates per stage. These basic metrics give you a complete picture of the health of your hiring process.
Additionally, source effectiveness and cost per hire are crucial for optimizing your recruitment budget. By measuring which sourcing channels deliver the best candidates at the lowest cost, you can allocate your resources more intelligently. This is especially relevant when you work with multiple sourcing channels and need to decide where your budget goes.
Prioritize metrics based on what your organization needs most. Growing companies often focus on speed and volume, while specialized roles require more attention to quality indicators like assessment scores and interview evaluations. Start with three to five core metrics and expand as your team gets used to data-driven working.
AI in recruitment processes can help automatically collect and analyze these metrics, giving you real-time insight without manual work.
Which tools and methods can you use to visualize recruitment pipelines?
There are several ways to visualize your recruitment pipeline, from simple manual solutions to advanced automated systems. The choice depends on your team size, budget, and need for integration with other systems.
- Spreadsheets – Suitable for small teams or starting organizations. You can easily create columns per stage and move candidates manually. The advantage is the low barrier and flexibility. The disadvantage is the manual work and lack of real-time insight, especially when multiple people work simultaneously.
- Kanban boards – Tools like Trello or physical whiteboards offer visual clarity. Candidates are displayed as cards that you move between columns. This works well for teams up to about 10 people, but doesn't scale easily with large volumes.
- Recruitment dashboards in ATS systems – Modern applicant tracking systems have built-in pipeline visualizations with automatic data updates. These systems integrate with your email, calendar, and other tools, so all information is centralized and you avoid duplicate work.
- Specialized analytics platforms – For larger organizations with complex processes, dedicated analytics tools offer deep insights and predictive models. These are more powerful but require more investment and technical knowledge.
For teams dealing with high volumes of applicants, automated systems are almost indispensable. Manual methods then become too time-consuming and error-prone. AI recruitment tasks like automatically categorizing candidates and predicting lead times make modern platforms much more efficient than traditional methods.
How do you interpret the data in your recruitment pipeline visualization?
Interpreting data goes beyond just looking at numbers. You need to recognize patterns, understand causes, and translate these insights into concrete improvement actions that make your hiring process more effective.
Start by identifying bottlenecks, the stages where candidates linger unnecessarily long. If you see that candidates wait an average of two weeks between screening and the first interview, you can adjust processes like automating invitations or reserving fixed interview slots. This makes your AI recruitment processes faster and prevents good candidates from dropping out.
Also pay attention to drop-off points where unexpectedly many candidates drop out. A high dropout rate after the first interview may indicate unclear expectations in the job description or a mismatch between what recruiters promise and what hiring managers are looking for. By recognizing these patterns, you can communicate more targeted and align the process.
Compare different sourcing channels systematically. If LinkedIn delivers candidates who pass screening three times more often than candidates from job boards, you can allocate your budget and time differently. These insights help you prioritize AI recruitment activities based on proven results.
Spot inefficiencies by monitoring conversion ratios between stages. A healthy pipeline has predictable conversions, for example 30% of screened candidates moving on to interviews. Large deviations call for investigation into the cause, whether it's overly strict criteria, unclear communication, or issues with candidate experience.
What steps do you take to successfully implement recruitment pipeline visualization?
Successful implementation starts with gathering requirements from all stakeholders. Talk to recruiters, hiring managers, and HR operations to understand what information they need and what pain points they experience in the current process. This ensures that your visualization is actually used and adds value.
Then choose the right technology that fits your organization. For teams that want to grow without hiring proportionally more people, automated tracking systems are a smart investment. These platforms offer not only visualization but also workflows that automate AI recruitment tasks, allowing your team to focus on personal contact with the best candidates.
Train your team thoroughly in using the new system. Make sure everyone understands what data they need to enter, how to read the visualizations, and what actions they can take based on the insights. Regular training sessions and clear documentation significantly increase adoption.
Continuously optimize based on feedback and results. Start with a basic version of your dashboard and expand as your team becomes more comfortable with data-driven working. Monitor which metrics actually lead to better decisions and adjust your visualizations accordingly.
Modern recruitment platforms make it possible to achieve cheaper AI recruitment and faster AI recruitment by automating processes that previously required a lot of manual work. This means you can fill more vacancies with the same team without compromising on quality.
Teams that need help setting up effective pipeline visualization can contact us for advice on which approach best fits their specific situation and ambitions. A good start with the right tools and insights saves a lot of time and frustration later in the process.